Return to flip book view
News Release FOR IMMEDIATE RELEASE: Home sale trend stabilizing in June VANCOUVER, BC – July 3, 2025 – After a turbulent first half of the year, home sales registered on the MLS® across Metro Vancouver* are showing emerging signs of a recovery, down ten per cent year-over-year – halving the decline seen last month. The Greater Vancouver REALTORS® (GVR) reports that residential sales in the region totalled 2,181 in June 2025, a 9.8 per cent decrease from the 2,418 sales recorded in June 2024. This was 25.8 per cent below the 10-year seasonal average (2,940). “On a trended basis, signs are emerging that sales activity is rounding the corner after a challenging first half to the year, with the year-over-year decline in sales in June halving the decline we saw in May,” said Andrew Lis, GVR’s director of economics and data analytics. “If this momentum continues, it may not be long before sales are up year-over-year, which would mark a shift toward a market with more demand than the unusually low demand we’ve seen so far this year.” There were 6,315 detached, attached and apartment properties newly listed for sale on the Multiple Listing Service® (MLS®) in Metro Vancouver in June 2025. This represents a 10.3 per cent increase compared to the 5,723 properties listed in June 2024. This was 12.7 per cent above the 10-year seasonal average (5,604). The total number of properties currently listed for sale on the MLS® system in Metro Vancouver is 17,561, a 23.8 per cent increase compared to June 2024 (14,182). This is 43.7 per cent above the 10-year seasonal average (12,223). Across all detached, attached and apartment property types, the sales-to-active listings ratio for June 2025 is 12.8 per cent. By property type, the ratio is 9.9 per cent for detached homes, 16.9 per cent for attached, and 13.9 per cent for apartments. Analysis of the historical data suggests downward pressure on home prices occurs when the ratio dips below 12 per cent for a sustained period, while home prices often experience upward pressure when it surpasses 20 per cent over several months. “As home sales regain their footing, inventory levels aren’t building as quickly as we’ve seen lately,” Lis said. “Most market segments remain in balanced market conditions, which has
generally kept prices trending sideways since the start of the year. With over 17,000 listings on the market right now, and with mortgage rates down around two per cent since last summer, buyers are enjoying some of the most favorable conditions seen in years.” The MLS® Home Price Index composite benchmark price for all residential properties in Metro Vancouver is currently $1,173,100. This represents a 2.8 per cent decrease over June 2024 and a 0.3 per cent decrease compared to May 2025. Sales of detached homes in June 2025 reached 657, a 5.3 per cent decrease from the 694 detached sales recorded in June 2024. The benchmark price for a detached home is $1,994,500. This represents a 3.2 per cent decrease from June 2024 and a 0.1 per cent decrease compared to May 2025. Sales of apartment homes reached 1,040 in June 2025, a 16.5 per cent decrease compared to the 1,245 sales in June 2024. The benchmark price of an apartment home is $748,400. This represents a 3.2 per cent decrease from June 2024 and a 1.2 per cent decrease compared to May 2025. Attached home sales in June 2025 totalled 473, a 3.7 per cent increase compared to the 456 sales in June 2024. The benchmark price of a townhouse is $1,103,900. This represents a three per cent decrease from June 2024 and a 0.3 per cent decrease compared to May 2025. -30- Editor’s Note: *Areas covered by Greater Vancouver REALTORS® include: Bowen Island, Burnaby, Coquitlam, Maple Ridge, New Westminster, North Vancouver, Pitt Meadows, Port Coquitlam, Port Moody, Richmond, South Delta, Squamish, Sunshine Coast, Vancouver, West Vancouver, and Whistler. Greater Vancouver REALTORS® is an association representing more than 15,000 REALTORS® and their companies. The association provides a variety of member services, including the Multiple Listing Service®. For more information on real estate, statistics, and buying or selling a home, contact a local REALTOR® or visit www.gvrealtors.ca. For more information please contact: Mark Moldowan Manager, Communication and Editorial Greater Vancouver REALTORS® 604.730.3153 mmoldowan@gvrealtors.ca
Property Type AreaBenchmark PricePrice Index1 Month Change %3 Month Change %6 Month Change %1 Year Change %3 Year Change %5 Year Change %10 Year Change %Residential / Composite Lower Mainland $1,098,200 335.2 -0.6% -1.8% -0.3% -3.3% -7.7% 30.1% 58.3%Greater Vancouver $1,173,100 333.6 -0.4% -1.5% 0.1% -2.8% -4.7% 26.3% 49.3%Bowen Island $1,407,400 294.5 -1.3% 1.7% -1.5% -7.7% -16.0% 38.8% 120.3%Burnaby East $1,083,400 344.5 -1.1% -4.7% -4.2% -7.2% -5.9% 23.1% 63.6%Burnaby North $981,900 327.2 0.1% -2.7% -0.5% -4.0% -7.9% 21.1% 56.8%Burnaby South $1,095,500 339.5 -1.0% -2.5% -2.4% -4.5% -6.2% 16.4% 55.9%Coquitlam $1,064,700 334.5 -0.8% -2.1% -0.9% -4.4% -8.8% 27.5% 75.2%Ladner $1,143,700 332.8 -0.4% -1.4% -0.4% -1.1% -3.6% 39.6% 85.0%Maple Ridge $969,200 337.1 -0.8% -0.8% -0.5% -2.3% -8.9% 42.3% 125.6%New Westminster $795,000 363.8 -1.0% -2.9% -3.2% -3.7% -4.4% 28.0% 83.6%North Vancouver $1,375,600 320.3 -0.3% 0.4% 4.2% -1.6% -3.3% 26.7% 59.4%Pitt Meadows $923,500 368.8 -1.1% -2.7% -1.2% -1.6% -5.2% 42.9% 139.2%Port Coquitlam $946,800 368.1 -1.0% -0.9% 0.5% -1.6% -2.8% 44.8% 113.4%Port Moody $1,102,300 351.8 0.5% 0.6% -0.5% -3.6% -8.4% 35.0% 91.0%Richmond $1,123,300 369.9 -0.7% -3.0% -1.9% -4.4% -4.8% 28.7% 55.9%Squamish $1,134,100 376.8 -0.5% 0.6% 6.4% 3.1% -5.2% 43.9% 136.8%Sunshine Coast $834,800 305.8 1.0% 1.6% 0.3% -3.7% -11.7% 45.3% 133.1%Tsawwassen $1,192,700 310.0 -1.0% -2.6% -1.0% -3.1% -8.8% 28.9% 60.5%Vancouver East $1,213,200 378.5 -0.3% -0.7% 0.5% -1.6% -0.5% 27.9% 58.6%Vancouver West $1,320,800 313.3 -0.1% -1.8% 0.8% -2.3% -0.9% 14.3% 19.5%West Vancouver $2,506,100 270.4 0.6% -1.3% -2.3% -5.1% -13.2% 15.0% 15.1%Whistler $1,373,500 304.2 0.2% 1.2% 5.9% -1.1% -14.4% 34.4% 128.9%Single Family Detached Lower Mainland $1,772,300 389.0 -0.6% -2.4% -0.5% -3.4% -5.0% 38.8% 71.6%Greater Vancouver $1,994,500 371.2 -0.1% -2.0% -0.1% -3.2% -2.9% 33.2% 53.1%Bowen Island $1,408,400 294.0 -1.3% 1.6% -1.5% -7.7% -16.0% 38.7% 120.4%Burnaby East $1,869,700 401.7 0.1% -6.3% -4.5% -4.8% 0.6% 37.2% 85.5%Burnaby North $2,131,900 407.8 1.8% -1.4% 0.0% -1.9% 0.8% 40.1% 76.1%Burnaby South $2,163,100 412.9 -3.7% -3.4% -3.1% -4.5% -1.9% 30.9% 69.6%Coquitlam $1,750,600 406.3 -1.6% -3.5% -1.2% -5.0% -5.7% 38.8% 98.5%Ladner $1,407,200 342.7 0.6% -1.0% 0.8% -0.2% -4.1% 41.8% 87.6%Maple Ridge $1,282,700 375.4 -0.3% -0.4% -0.3% -1.5% -6.7% 47.0% 148.3%New Westminster $1,512,500 371.5 -0.8% -6.0% -4.3% -5.1% -1.8% 34.9% 85.7%North Vancouver $2,214,800 347.7 -1.1% -1.3% 3.9% -3.9% -3.3% 30.1% 70.0%Pitt Meadows $1,277,000 382.7 -2.4% -3.6% -1.8% -1.9% -7.5% 41.1% 127.8%Port Coquitlam $1,382,900 391.4 -2.1% -2.5% 0.2% -2.9% -2.7% 48.0% 117.4%Port Moody $2,116,200 404.9 1.9% 0.2% 1.0% -3.1% -3.0% 47.1% 106.7%Richmond $2,117,100 429.3 0.6% -2.5% -1.1% -3.7% -2.5% 31.1% 67.4%Squamish $1,674,400 417.7 -0.2% 1.5% 10.3% 8.2% -6.3% 42.3% 163.5%Sunshine Coast $891,600 310.1 1.5% 2.0% -0.6% -4.4% -12.8% 45.7% 136.5%Tsawwassen $1,583,800 349.6 -1.1% -4.0% -0.7% -0.4% -6.6% 37.4% 79.2%Vancouver East $1,831,800 408.6 0.2% -1.2% -1.3% -3.2% -3.7% 28.2% 61.2%Vancouver West $3,399,000 354.2 1.1% -1.5% 0.7% -4.5% -3.7% 12.9% 23.9%West Vancouver $3,191,100 297.4 -0.1% -2.6% -3.5% -4.3% -8.3% 21.3% 25.5%Whistler $2,534,200 329.4 -1.9% -0.6% 5.7% 0.6% -10.0% 38.8% 128.6%HOW TO READ THE TABLE:• Benchmark Price: Estimated sale price of a benchmark property. Benchmarks represent a typical property within each market.• Price Index: Index numbers estimate the percentage change in price on typical and constant quality properties over time. All figures are based on past sales.• x Month/Year Change %: Percentage change of index over a period of x month(s)/year(s)*In January 2005, the indexes are set to 100.Townhome properties are similar to Attached properties, a category that was used in the previous MLSLink HPI, but do not included duplexes.The above info is deemed reliable, but is not guaranteed. All dollar amounts in CDN.June 2025** MLS®, Multiple Listing Service®, and all related graphics are trademarks of The Canadian Real Estate Association 1 of 22
Property Type AreaBenchmark PricePrice Index1 Month Change %3 Month Change %6 Month Change %1 Year Change %3 Year Change %5 Year Change %10 Year Change %June 2025*Townhouse Lower Mainland $970,200 370.4 -0.5% -1.0% -0.6% -2.8% -3.5% 41.3% 116.5%Greater Vancouver $1,103,900 385.6 -0.3% -0.8% -1.0% -3.0% -1.1% 38.2% 111.6%Burnaby East $907,000 395.0 -1.4% 0.1% 2.9% -2.3% 4.5% 34.5% 115.3%Burnaby North $930,700 378.9 1.2% 2.9% 2.0% -2.6% -4.1% 35.1% 115.7%Burnaby South $1,075,700 394.3 0.4% 2.3% 1.8% -2.3% 0.4% 33.2% 112.9%Coquitlam $1,096,600 429.0 1.1% 1.2% 2.3% 1.1% 0.8% 44.1% 144.6%Ladner $997,500 396.0 -4.2% -2.4% -3.7% -1.4% 2.5% 37.4% 118.9%Maple Ridge $773,300 389.2 -1.4% -2.5% -0.5% -2.4% -6.6% 46.4% 167.5%New Westminster $905,100 388.0 -3.1% -1.9% -5.4% -4.9% -5.1% 34.1% 102.8%North Vancouver $1,352,100 369.9 0.1% 3.0% 3.1% -2.7% -0.3% 37.6% 118.7%Pitt Meadows $839,200 411.4 1.9% -1.7% 3.2% 0.6% -4.3% 42.0% 158.9%Port Coquitlam $949,600 382.7 -0.7% -0.1% 0.9% -0.1% -2.7% 44.3% 134.5%Port Moody $1,039,000 401.5 -0.1% 0.4% 0.8% -0.9% -6.9% 41.1% 141.3%Richmond $1,098,300 393.8 -2.3% -2.3% -3.2% -5.6% -0.7% 36.1% 104.9%Squamish $1,053,400 396.6 1.5% 0.3% 2.2% -1.5% 0.1% 53.8% 162.8%Sunshine Coast $756,900 354.2 -0.8% -1.3% 1.3% -3.1% 0.0% 58.1% 142.1%Tsawwassen $948,300 278.2 -5.2% -2.4% -5.9% -5.3% -7.1% 14.8% 42.8%Vancouver East $1,104,400 364.1 -1.5% -4.8% -3.7% -3.8% -1.0% 27.1% 86.2%Vancouver West $1,432,300 337.9 1.0% -3.2% -6.2% -4.0% -0.2% 24.1% 71.0%Whistler $1,672,900 410.4 1.9% -0.1% 0.6% -4.3% -2.0% 58.9% 188.4%Apartment Lower Mainland $693,900 348.2 -1.2% -2.5% -0.4% -3.4% -2.8% 23.4% 90.1%Greater Vancouver $748,400 346.3 -1.2% -2.5% -0.2% -3.2% -1.8% 20.2% 88.7%Burnaby East $773,200 327.5 -2.3% -1.4% -1.9% -3.6% -3.7% 19.2% 87.9%Burnaby North $724,900 354.5 -1.5% -4.3% -1.4% -4.6% -4.6% 23.6% 101.2%Burnaby South $811,100 371.6 -0.1% -3.1% -3.1% -3.8% -1.4% 14.2% 88.2%Coquitlam $710,800 398.0 -1.8% -3.2% -2.5% -4.8% -3.7% 25.9% 129.9%Ladner $693,500 352.2 0.3% 0.0% 7.9% -1.2% -5.4% 42.8% 115.5%Maple Ridge $514,600 367.8 -2.0% -0.9% -3.0% -3.8% -7.4% 36.0% 150.4%New Westminster $637,800 390.1 -0.9% -2.2% -1.9% -2.2% -1.9% 25.0% 114.2%North Vancouver $817,600 332.0 0.2% 0.0% 2.7% -0.8% 1.5% 25.1% 105.4%Pitt Meadows $587,100 406.3 -2.4% -1.0% -2.8% -3.4% -6.3% 32.9% 148.2%Port Coquitlam $638,300 440.2 0.3% -0.5% 1.0% -1.4% -0.5% 39.2% 163.8%Port Moody $741,300 406.0 -0.7% 0.4% -1.4% -2.5% 1.0% 30.1% 133.6%Richmond $708,800 393.6 -1.6% -4.9% -2.1% -5.1% -2.9% 25.2% 112.3%Squamish $619,800 366.3 -2.0% 2.5% 9.9% 3.7% -11.9% 40.5% 157.4%Sunshine Coast $509,700 308.0 -0.5% 3.2% 9.1% 0.4% -18.1% 24.0% 98.5%Tsawwassen $671,500 317.8 -0.6% -0.8% 5.0% -4.9% -4.1% 31.0% 97.0%Vancouver East $686,500 398.4 -1.4% -2.3% -0.5% -3.5% -2.5% 14.0% 87.7%Vancouver West $824,500 318.7 -1.7% -2.9% 0.6% -3.0% -1.5% 9.7% 66.9%West Vancouver $1,324,000 255.4 2.7% 4.5% 8.0% -2.0% 4.2% 28.8% 62.5%Whistler $666,600 287.5 -1.7% 2.4% 8.5% -1.4% -14.5% 41.1% 155.3%HOW TO READ THE TABLE:• Benchmark Price: Estimated sale price of a benchmark property. Benchmarks represent a typical property within each market.• Price Index: Index numbers estimate the percentage change in price on typical and constant quality properties over time. All figures are based on past sales.• x Month/Year Change %: Percentage change of index over a period of x month(s)/year(s)In January 2005, the indexes are set to 100.*Townhome properties are similar to attached properties, a category that was used in the previous MLSLink HPI, but do not included duplexes.Lower Mainland includes areas serviced by both Greater Vancouver Realtors & Fraser Valley Real Estate Board.The above info is deemed reliable, but is not guaranteed. All dollar amounts in CDN.* MLS®, Multiple Listing Service®, and all related graphics are trademarks of The Canadian Real Estate Association 2 of 22
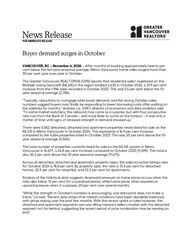
C:\DATA\MonthEnd\Hpi\export\hi_res\gv-hpi2.tif60110160210260310360410460Jun 2020Aug 2020Oct 2020Dec 2020Feb 2021Apr 2021Jun 2021Aug 2021Oct 2021Dec 2021Feb 2022Apr 2022Jun 2022Aug 2022Oct 2022Dec 2022Feb 2023Apr 2023Jun 2023Aug 2023Oct 2023Dec 2023Feb 2024Apr 2024Jun 2024Aug 2024Oct 2024Dec 2024Feb 2025Apr 2025Jun 2025Price IndexGreater Vancouver 5 Year TrendResidential Detached Townhouse ApartmentJan 2005 HPI = 100
6 5 2025MLS® SALES Facts Bowen Island Burnaby CoquitlamDelta - SouthIslands - Gulf Maple Ridge/Pitt Meadows New Westminster North Vancouver Port Coquitlam Port Moody/Belcarra Richmond Squamish Sunshine Coast Vancouver East Vancouver West West Vancouver/Howe SoundWhistler/PembertonDetached7 39 48 50 4 69 10 67 21 14 59 16 45 95 68 30 15 657Attached0 33 46 20 0 47 14 48 13 13 60 16 0 64 69 7 23 473Apartment0 177 77 20 0 32 47 85 24 20 124 18 2 108 280 15 11 1,040Detachedn/a $2,146,250 $1,722,500 $1,489,750 n/a $1,200,000 n/a $2,180,000 $1,350,000 n/a $1,990,000 n/a $1,050,000 $1,856,500 $3,290,000 $2,750,000 n/aAttachedn/a $1,035,000 $1,168,000 $886,500 n/a $799,900 n/a $1,405,000 n/a n/a $1,086,000 n/a n/a $1,336,500 $1,500,000 n/a $1,620,000 n/aApartmentn/a $695,000 $649,000 $611,000 n/a $505,000 $620,000 $765,000 $590,000 $681,500 $672,300 n/a n/a $677,500 $800,000 n/a n/aDetached6 37 54 33 6 76 20 81 16 17 62 17 51 72 53 45 8 654Attached0 49 37 18 0 39 12 40 21 14 44 21 4 70 66 9 25 469Apartment0 176 98 23 0 34 59 83 18 30 125 17 4 101 290 14 15 1,087Detachedn/a $1,950,000 $1,649,000 $1,511,000 n/a $1,290,000 $1,425,000 $2,150,000 n/a n/a $1,950,000 n/a $875,000 $1,866,000 $3,425,000 $3,045,000 n/aAttachedn/a $1,105,000 $1,100,000 n/a n/a $790,000 n/a $1,351,000 $970,000 n/a $1,107,500 $1,019,000 n/a $1,350,000 $1,457,000 n/a $1,750,000 n/aApartmentn/a $646,500 $677,810 $696,000 n/a $567,450 $655,000 $802,500 n/a $790,000 $647,857 n/a n/a $704,500 $820,000 n/a n/aDetached3 65 54 33 2 82 18 70 20 6 75 22 35 75 83 43 8 694Attached0 51 39 20 0 34 9 45 15 16 56 17 9 67 59 6 13 456Apartment0 208 94 16 0 41 82 103 27 33 130 12 2 127 327 25 18 1,245Detachedn/a $2,220,000 $1,793,000 $1,488,000 n/a $1,327,500 n/a $2,437,500 $1,451,250 n/a $1,960,000 $1,655,000 $997,000 $2,095,000 $3,634,000 $2,875,000 n/aAttachedn/a $1,135,000 $1,213,000 $892,500 n/a $820,000 n/a $1,442,500 n/a n/a $1,192,500 n/a n/a $1,515,000 $1,520,000 n/a n/a n/aApartmentn/a $729,450 $702,000 n/a n/a $533,000 $632,000 $730,000 $544,400 $852,000 $728,000 n/a n/a $680,000 $888,000 $940,000 n/aDetached29 215 270 177 22 395 62 371 117 76 305 93 236 388 296 173 48 3,273Attached0 213 280 88 2 252 63 205 97 67 295 115 25 383 312 27 112 2,536Apartment0 975 546 121 2 195 377 501 154 136 690 87 20 587 1,600 66 106 6,163Detached$1,500,000 $2,120,000 $1,705,000 $1,509,523 $852,500 $1,270,000 $1,505,000 $2,175,000 $1,429,950 $1,850,000 $1,950,000 $1,690,000 $902,881 $1,860,768 $3,334,000 $2,998,000 $2,633,500Attachedn/a $1,075,000 $1,178,000 $970,000 n/a $805,000 $942,000 $1,389,000 $960,000 $1,060,000 $1,098,000 $1,075,000 $700,000 $1,412,500 $1,528,000 $1,900,000 $1,317,500 n/aApartmentn/a $710,000 $674,750 $660,000 n/a $533,238 $623,990 $795,250 $599,500 $762,500 $668,000 $707,500 $559,500 $687,500 $825,000 $1,225,000 $692,000Detached26 325 327 182 18 541 85 379 136 58 415 89 223 475 439 213 56 3,987Attached0 251 258 113 1 303 60 222 111 92 339 95 34 450 305 19 89 2,742Apartment0 1,144 599 100 0 241 423 575 208 154 803 57 23 718 1,739 107 153 7,044Detached$1,375,000 $2,160,000 $1,790,000 $1,494,000 n/a $1,290,000 $1,555,000 $2,275,000 $1,465,000 $1,899,000 $2,100,000 $1,570,000 $945,857 $1,974,950 $3,557,500 $2,922,200 $2,350,000Attachedn/a $1,075,000 $1,169,000 $1,070,000 n/a $815,000 $1,012,500 $1,425,000 $962,500 $1,062,500 $1,180,000 $1,005,000 $644,500 $1,500,000 $1,675,000 n/a $1,450,000 n/aApartmentn/a $730,000 $683,000 $677,500 n/a $539,800 $636,000 $799,875 $625,700 $763,500 $713,800 $606,000 $580,000 $699,900 $850,000 $1,300,000 $558,800Note: Median Selling Prices are not reported for areas with less than 20 sales or for the Gulf IslandsJan. -Jun. 2024NumberofSalesMedianSellingPriceJune2024NumberofSalesMedianSellingPriceJan. -Jun. 2025NumberofSalesMedianSellingPriceJune2025NumberofSalesMedianSellingPriceMay2025NumberofSalesMedianSellingPriceJune2025TOTALSYear-to-dateYear-to-date
6 5 2025MLS® LISTINGS Facts Bowen Island Burnaby CoquitlamDelta - SouthIslands - Gulf Maple Ridge/Pitt Meadows New Westminster North Vancouver Port Coquitlam Port Moody/Belcarra Richmond Squamish Sunshine Coast Vancouver East Vancouver West West Vancouver/Howe SoundWhistler/PembertonDetached24 161 168 110 19 221 55 206 77 47 186 32 133 248 217 151 29 2,084Attached0 120 136 37 0 105 51 108 34 42 165 42 21 195 169 14 30 1,269Apartment0 454 262 36 0 85 163 211 65 72 375 17 5 305 814 57 37 2,958Detached29% 24% 29% 45% 21% 31% 18% 33% 27% 30% 32% 50% 34% 38% 31% 20% 52%Attachedn/a 28% 34% 54% n/a 45% 27% 44% 38% 31% 36% 38% 0% 33% 41% 50% 77% n/aApartmentn/a 39% 29% 56% n/a 38% 29% 40% 37% 28% 33% 106% 40% 35% 34% 26% 30%Detached19 184 200 114 15 271 39 214 68 58 220 45 158 248 254 164 45 2,316Attached0 111 112 54 0 126 41 97 45 44 157 36 16 202 191 20 26 1,278Apartment0 477 205 47 0 84 178 246 72 87 353 48 9 314 821 41 38 3,020Detached32% 20% 27% 29% 40% 28% 51% 38% 24% 29% 28% 38% 32% 29% 21% 27% 18%Attachedn/a 44% 33% 33% n/a 31% 29% 41% 47% 32% 28% 58% 25% 35% 35% 45% 96% n/aApartmentn/a 37% 48% 49% n/a 40% 33% 34% 25% 34% 35% 35% 44% 32% 35% 34% 39%Detached14 151 148 70 18 235 34 162 60 43 163 37 140 211 224 142 34 1,886Attached0 108 92 35 3 96 29 87 40 29 119 28 20 178 172 18 26 1,080Apartment0 522 211 37 0 68 147 205 71 60 275 27 10 257 778 53 34 2,755Detached21% 43% 36% 47% 11% 35% 53% 43% 33% 14% 46% 59% 25% 36% 37% 30% 24%Attachedn/a 47% 42% 57% 0% 35% 31% 52% 38% 55% 47% 61% 45% 38% 34% 33% 50% n/aApartmentn/a 40% 45% 43% n/a 60% 56% 50% 38% 55% 47% 44% 20% 49% 42% 47% 53%Detached99 875 956 582 92 1, 345 236 1,063 390 264 1,141 203 799 1,301 1,290 924 168 11,728Attached0 633 730 264 1 591 215 543 215 203 853 201 87 1,122 1,065 98 174 6,995Apartment0 2,906 1,558 265 3 536 1,055 1,381 399 426 2,125 205 59 1,744 4,959 262 236 18,119Detached29% 25% 28% 30% 24% 29% 26% 35% 30% 29% 27% 46% 30% 30% 23% 19% 29%Attachedn/a 34% 38% 33% 200% 43% 29% 38% 45% 33% 35% 57% 29% 34% 29% 28% 64% n/aApartmentn/a 34% 35% 46% 67% 36% 36% 36% 39% 32% 32% 42% 34% 34% 32% 25% 45%Detached78 739 828 422 79 1, 337 232 851 326 197 1,037 212 710 1,179 1,206 903 163 10,499Attached1 535 554 197 7 583 137 505 201 158 651 163 78 1,072 885 74 213 6,014Apartment0 2,711 1,202 207 0 554 827 1,158 353 284 1,686 131 60 1,603 4,636 297 273 15,982Detached33% 44% 39% 43% 23% 40% 37% 45% 42% 29% 40% 42% 31% 40% 36% 24% 34%Attached0% 47% 47% 57% 14% 52% 44% 44% 55% 58% 52% 58% 44% 42% 34% 26% 42% n/aApartmentn/a 42% 50% 48% n/a 44% 51% 50% 59% 54% 48% 44% 38% 45% 38% 36% 56%* Year-to-date listings represent a cumulative total of listings rather than total active listings.Jan. -Jun. 2024NumberofListings% Sales to ListingsJune2024NumberofListings% Sales to ListingsJan. -Jun. 2025NumberofListings% Sales to ListingsJune2025NumberofListings% Sales to ListingsMay2025NumberofListings% Sales to ListingsJune2025TOTALSYear-to-date*Year-to-date*
Listing & Sales Activity SummaryListings Sales1 2 3 Col. 2 & 3 5 6 7 Col. 6 & 7 9 10 Col. 9 & 10Jun May Jun Percentage Jun May Jun Percentage Apr 2024 - Apr 2025 - Percentage2024 2025 2025 Variance 2024 2025 2025 Variance Jun 2024 Jun 2025 VarianceBOWEN ISLAND % % %DETACHED 14 19 24 26.3 3 6 7 16.7 16 17 6.3ATTACHED 0 0 0 0.0 0 0 0 0.0 0 0 0.0APARTMENTS 0 0 0 0.0 0 0 0 0.0 0 0 0.0BURNABY % % %DETACHED 151 184 161 -12.5 65 37 39 5.4 186 114 -38.7ATTACHED 108 111 120 8.1 51 49 33 -32.7 152 114 -25.0APARTMENTS 522 477 454 -4.8 208 176 177 0.6 642 544 -15.3COQUITLAMDETACHED 148 200 168 -16.0 54 54 48 -11.1 196 148 -24.5ATTACHED 92 112 136 21.4 39 37 46 24.3 131 147 12.2APARTMENTS 211 205 262 27.8 94 98 77 -21.4 323 252 -22.0DELTADETACHED 70 114 110 -3.5 33 33 50 51.5 101 109 7.9ATTACHED 35 54 37 -31.5 20 18 20 11.1 65 49 -24.6APARTMENTS 37 47 36 -23.4 16 23 20 -13.0 59 62 5.1ISLANDS - GULFDETACHED 18 15 19 26.7 2 6 4 -33.3 8 12 50.0ATTACHED 3 0 0 0.0 0 0 0 0.0 0 1 100.0APARTMENTS 0 0 0 0.0 0 0 0 0.0 0 0 0.0MAPLE RIDGE/PITT MEADOWSDETACHED 235 271 221 -18.5 82 76 69 -9.2 289 219 -24.2ATTACHED 96 126 105 -16.7 34 39 47 20.5 163 127 -22.1APARTMENTS 68 84 85 1.2 41 34 32 -5.9 126 104 -17.5NEW WESTMINSTERDETACHED 34 39 55 41.0 18 20 10 -50.0 44 42 -4.5ATTACHED 29 41 51 24.4 9 12 14 16.7 38 37 -2.6APARTMENTS 147 178 163 -8.4 82 59 47 -20.3 246 170 -30.9NORTH VANCOUVERDETACHED 162 214 206 -3.7 70 81 67 -17.3 244 221 -9.4ATTACHED 87 97 108 11.3 45 40 48 20.0 139 121 -12.9APARTMENTS 205 246 211 -14.2 103 83 85 2.4 328 264 -19.5PORT COQUITLAMDETACHED 60 68 77 13.2 20 16 21 31.3 85 64 -24.7ATTACHED 40 45 34 -24.4 15 21 13 -38.1 60 53 -11.7APARTMENTS 71 72 65 -9.7 27 18 24 33.3 114 66 -42.1PORT MOODY/BELCARRADETACHED 43 58 47 -19.0 6 17 14 -17.6 33 45 36.4ATTACHED 29 44 42 -4.5 16 14 13 -7.1 58 40 -31.0APARTMENTS 60 87 72 -17.2 33 30 20 -33.3 92 72 -21.7RICHMONDDETACHED 163 220 186 -15.5 75 62 59 -4.8 238 168 -29.4ATTACHED 119 157 165 5.1 56 44 60 36.4 190 153 -19.5APARTMENTS 275 353 375 6.2 130 125 124 -0.8 461 366 -20.6SQUAMISHDETACHED 37 45 32 -28.9 22 17 16 -5.9 54 58 7.4ATTACHED 28 36 42 16.7 17 21 16 -23.8 60 61 1.7APARTMENTS 27 48 17 -64.6 12 17 18 5.9 40 54 35.0SUNSHINE COASTDETACHED 140 158 133 -15.8 35 51 45 -11.8 136 137 0.7ATTACHED 20 16 21 31.3 9 4 0 -100.0 22 10 -54.5APARTMENTS 10 9 5 -44.4 2 4 2 -50.0 12 13 8.3VANCOUVER EASTDETACHED 211 248 248 0.0 75 72 95 31.9 296 234 -20.9ATTACHED 178 202 195 -3.5 67 70 64 -8.6 242 197 -18.6APARTMENTS 257 314 305 -2.9 127 101 108 6.9 408 319 -21.8VANCOUVER WESTDETACHED 224 254 217 -14.6 83 53 68 28.3 270 173 -35.9ATTACHED 172 191 169 -11.5 59 66 69 4.5 182 188 3.3APARTMENTS 778 821 814 -0.9 327 290 280 -3.4 989 891 -9.9WEST VANCOUVER/HOWE SOUNDDETACHED 142 164 151 -7.9 43 45 30 -33.3 121 101 -16.5ATTACHED 18 20 14 -30.0 6 9 7 -22.2 13 17 30.8APARTMENTS 53 41 57 39.0 25 14 15 7.1 75 39 -48.0WHISTLER/PEMBERTONDETACHED 34 45 29 -35.6 8 8 15 87.5 37 27 -27.0ATTACHED 26 26 30 15.4 13 25 23 -8.0 44 69 56.8APARTMENTS 34 38 37 -2.6 18 15 11 -26.7 84 41 -51.2GRAND TOTALSDETACHED 1886 2316 2084 -10.0 694 654 657 0.5 2354 1889 -19.8ATTACHED 1080 1278 1269 -0.7 456 469 473 0.9 1559 1384 -11.2APARTMENTS 2755 3020 2958 -2.1 1245 1087 1040 -4.3 3999 3257 -18.6
05001000150020002500Residential Average Sale Prices - January 1977 to June 2025DETACHED CONDOMINIUM ATTACHED APARTMENTSIN THOUSANDS ($)NOTE: From 1977 - 1984 condominium averages were not separated into attached & apartment.$1,246,816$781,808$2,078,420`````